


Results for the half year to 30 September 2024

Allison Kirkby, Chief Executive, commenting on the results, said “We have accelerated the modernisation of BT Group in the first half of the year. We’ve ramped up our full fibre build and connections, seen further improvements in customer satisfaction, and our cost transformation contributed to growth in EBITDA and normalised free cash flow despite revenue declines driven by our non-UK operations and a competitive retail environment. “Our nationwide full fibre rollout has set new records, now reaching more than 16 million premises, and we have further extended our industry-leading take-up rate to 35%. Our cost to build continues to reduce, enabling us to increase this year's build target to 4.2 million with no additional capex spend. We also expanded our 5G network to cover 80% of the UK population, more than any other operator. These investments in the UK’s next generation networks are enabling much better experiences, reflected in our improved net promoter scores. “We are confirming our EBITDA, capex and cash flow guidance for FY25, albeit on lower revenue guidance. We remain firmly on track to meet our long-term cost savings and cash flow targets, and today announce an interim dividend of 2.40pps. The accelerated modernisation of our operations, combined with a focus on connecting the UK, puts us in a strong position to generate significant value for all our stakeholders.” |
Solid progress on strategic priorities
- Record FTTP build rate of 2.1m in the half with FTTP footprint passing 16m premises, around half of the UK, in October. We have increased our FY25 build target to 4.2m within our existing capex envelope driven by build cost efficiencies; on track to reach 25m by December 2026
- Strong customer demand for Openreach FTTP with record net adds of 446k in Q2; total premises connected 5.5m with an increased and market-leading take up rate of 35%. Growth in FTTP as a proportion of the broadband base contributed to a reduction in 12-month repair volumes of 0.3m to 3.0m, supporting growth in margin and EBITDA
- Openreach broadband ARPU in H1 grew year-on-year by 6% to £16, ahead of the CPI price increases, driven by a greater FTTP take-up and speed mix; Openreach broadband line losses in H1 were 377k, a 2% decline in the broadband base - we continue to see moderately higher competitor losses with a weaker overall broadband and new homes market
- Retail FTTP base grew by 35% year-on-year to 3.0m of which Consumer 2.8m and Business 0.2m; 5G base 12.5m, up 25% year-on-year
- Consumer postpaid mobile base at 13.9m; Consumer broadband base marginally lower at 8.2m. Consumer ARPUs relatively stable despite lower CPI benefits
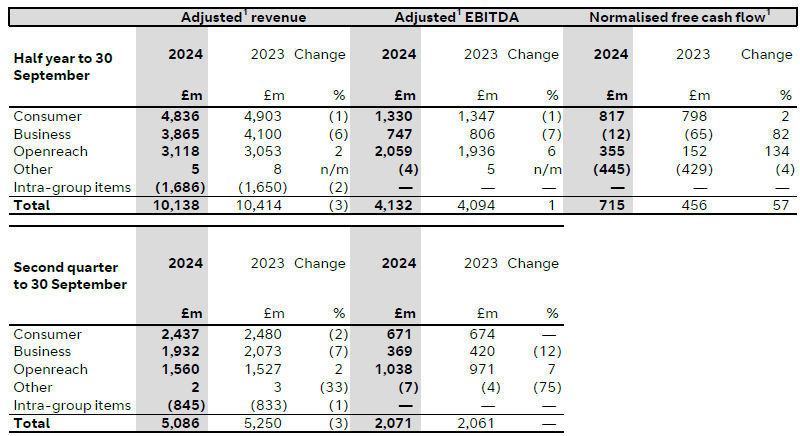
- Business revenue decline due primarily to non-UK trading in our Global and Portfolio channels
- Cost transformation on track with £433m gross annualised cost savings during H1 FY25; Total Labour Resource down 2k to 118k and down 4% year-on-year
- BT Group NPS of 25.6, up 3.1pts year-on-year, further improving customer experience
Continued EBITDA and normalised free cash flow1 improvement:
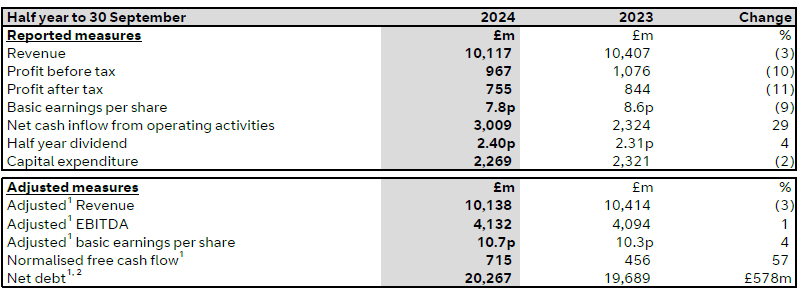
- Adjusted1 revenue £10.1bn, down 3% mainly due to challenging conditions in Business, principally driven by non-UK trading in our Global and Portfolio channels. In the rest of the Group, lower CPI benefit and continued competitive markets in Consumer were broadly offset by growth in Openreach due to the benefit of price increases, Ethernet base growth and improving FTTP volume and mix; reported revenue £10.1bn, down 3%
- Adjusted1 EBITDA £4.1bn, up 1%, with revenue flow through more than offset by cost transformation
- Reported profit before tax £1.0bn, down 10% primarily due to lower revenue, higher specific costs and higher net finance expenses, partly offset by reduction in reported operating costs
- Capital expenditure ('capex') £2.3bn, down 2% with peak reported capex passed in FY24, primarily driven by lower networks spend despite higher FTTP build due to reduced unit costs and efficiencies; cash capex of £2.5bn in line with prior year
- Net cash inflow from operating activities £3.0bn; normalised free cash flow1 £0.7bn, up 57% due to higher EBITDA, working capital timing and a tax refund
- Net debt £20.3bn (31 March 2024: £19.5bn), increased mainly due to our scheduled pension scheme contributions of £0.8bn with cash inflow offset by payment of the final dividend
- Gross IAS 19 pension deficit of £4.3bn, a decrease from £4.8bn at 31 March 2024 mainly due to scheduled contributions, partly offset by lower than required asset returns in the period
- Interim dividend of 2.40 pence per share (pps) up from 2.31pps in H1 FY24 in line with our policy of paying 30% of prior year's full year dividend pps. FY24 final dividend paid in September was fully covered by normalised free cash flow1
- FY25 Outlook: FY25 guidance reiterated for adjusted EBITDA1, capital expenditure and normalised free cash flow1. FY25 revenue guidance revised to down 1-2% primarily reflecting weaker non-UK trading including reduced low-margin kit sales, along with a softer environment in Corporate and Public Sector
- Mid-term guidance: Sustained adjusted1 revenue growth and EBITDA growth ahead of revenue, enhanced by cost transformation from FY26 to FY30; capital expenditure excluding spectrum less than £4.8bn until FY26, reducing by c. £1bn post peak FTTP build; normalised free cash flow of c. £2.0bn in FY27 and c. £3.0bn by the end of the decade
Customer-facing unit updates
1 See Glossary.
2 Net debt was £19,479m at 31 March 2024.
n/m: comparison not meaningful
Glossary
| Adjusted | Adjusted measures (including adjusted revenue, adjusted operating costs, adjusted operating profit, and adjusted basic earnings per share) are before specific items. Adjusted results are consistent with the way that financial performance is measured by management and assist in providing an additional analysis of the reporting trading results of the group. |
| Adjusted EBITDA | Earnings before interest, tax, depreciation and amortisation, before specific items, share of post tax profits/losses of associates and joint ventures and net finance expense. |
| Free cash flow | Net cash inflow from operating activities after net capital expenditure. |
| Capital expenditure | Additions to property, plant and equipment and intangible assets in the period. |
| Normalised free cash flow | Free cash flow (net cash inflow from operating activities after net capital expenditure) after net interest paid, payment of lease liabilities, net cash flows from the sale of cash flows related to contract assets, monies received as prepayment for the sale of redundant copper, dividends received from non-current assets investments, associates and joint ventures, and net purchase or disposal of non-current asset investments, before pension deficit payments (including their cash tax benefit), payments relating to spectrum, and specific items. It excludes cash flows that are determined at a corporate level independently of ongoing trading operations such as dividends paid, share buybacks, acquisitions and disposals, repayment and raising of debt, cash flows relating to loans with joint ventures, and cash flows relating to the Building Digital UK demand deposit account which have already been accounted for within normalised free cash flow. For non-tax related items the adjustments are made on a pre-tax basis. |
| Net debt | Loans and other borrowings and lease liabilities (both current and non-current), less current asset investments and cash and cash equivalents, including items which have been classified as held for sale on the balance sheet. Amounts due to joint ventures, loans and borrowings recognised in relation to monies received from the sale of cash flows of contract assets and as prepayment for the forward sale of redundant copper are excluded. Currency denominated balances within net debt are translated into sterling at swapped rates where hedged. Fair value adjustments and accrued interest applied to reflect the effective interest method are removed. |
| Specific items | Items that in management’s judgement need to be disclosed separately by virtue of their size, nature or incidence. In the current period these relate to our assessment of our provision for historic regulatory matters, restructuring charges, divestment-related items, Sports JV-related items and net interest expense on pensions. In determining whether an event or transaction is specific, management considers quantitative as well as qualitative factors such as the frequency or predictability of occurrence. |
We assess the performance of the group using a variety of alternative performance measures. Reconciliations from the most directly comparable IFRS measures are in Additional Information on pages 32 to 33 in the results release.
Forward-looking statements – caution advised
Certain information included in this announcement is forward looking and involves risks, assumptions and uncertainties that could cause actual results to differ materially from those expressed or implied by forward looking statements. Forward looking statements cover all matters which are not historical facts and include, without limitation, projections relating to results of operations and financial conditions and the Company’s plans and objectives for future operations. Forward looking statements can be identified by the use of forward looking terminology, including terms such as ‘believes’, ‘estimates’, ‘anticipates’, ‘expects’, ‘forecasts’, ‘intends’, ‘plans’, ‘projects’, ‘goal’, ‘target’, ‘aim’, ‘may’, ‘will’, ‘would’, ‘could’ or ‘should’ or, in each case, their negative or other variations or comparable terminology. Forward looking statements in this announcement are not guarantees of future performance. All forward looking statements in this announcement are based upon information known to the Company on the date of this announcement. Accordingly, no assurance can be given that any particular expectation will be met and readers are cautioned not to place undue reliance on forward looking statements, which speak only at their respective dates. Additionally, forward looking statements regarding past trends or activities should not be taken as a representation that such trends or activities will continue in the future. Other than in accordance with its legal or regulatory obligations (including under the UK Listing Rules and the Disclosure Guidance and Transparency Rules of the Financial Conduct Authority), the Company undertakes no obligation to publicly update or revise any forward looking statement, whether as a result of new information, future events or otherwise. Nothing in this announcement shall exclude any liability under applicable laws that cannot be excluded in accordance with such laws.

Download PDF - Results for the half year to 30 September 2024
BT Group is the UK’s leading provider of fixed and mobile telecommunications and related secure digital products, solutions and services. We also provide managed telecommunications, security and network & IT infrastructure services to customers across 180 countries.
BT Group consists of three customer-facing units: Consumer serves individuals and families in the UK; Business covers companies and public services in the UK and internationally; Openreach is an independently governed, wholly owned subsidiary wholesaling fixed access infrastructure services to its customers - over 700 communications providers across the UK.
British Telecommunications plc is a wholly owned subsidiary of BT Group plc and encompasses virtually all businesses and assets of the BT Group. BT Group plc is listed on the London Stock Exchange.
For more information, visit www.bt.com/about


